# Grafana

# Installation sous Debian 10 Buster

### MariaDB

Dépôt officiel MariaDB

```shell
apt install software-properties-common dirmngr
apt-key adv --fetch-keys 'https://mariadb.org/mariadb_release_signing_key.asc'
add-apt-repository 'deb [arch=amd64] http://ftp.igh.cnrs.fr/pub/mariadb/repo/10.4/debian buster main'
```

Installation de MariaDB

```shell
apt update
apt install -y mariadb-client mariadb-server
```

Configurer et sécuriser MariaDB :

```shell
mariadb-secure-installation
```

Création de la base et de l'utilisateur pour Grafana

```shell
mysql -u root
```

```shell
CREATE DATABASE grafana CHARACTER SET UTF8 COLLATE UTF8_BIN;
CREATE USER 'grafana'@'%' IDENTIFIED BY 'password';
GRANT ALL PRIVILEGES ON grafana.* TO 'grafana'@'%';
quit;
```

### Grafana

Dépôt officiel Grafana

```shell
apt-key adv --fetch-keys 'https://packages.grafana.com/gpg.key'
add-apt-repository 'deb [arch=amd64,i386] https://packages.grafana.com/oss/deb stable main'
apt-get update
```

Installation de Grafana

```shell
apt install -y grafana
```

Configuration de Grafana pour communiquer avec MariaDB

```shell
vi /etc/grafana/grafana.ini
```

```shell
[database]
type = mysql
host = 127.0.0.1:3306
name = grafana
user = grafana
password = password

[session]
provider = mysql
provider_config = `grafana:password@tcp(127.0.0.1:3306)/grafana`
```

Service

```shell
systemctl enable --now grafana-server
systemctl start grafana-server
```

Etat du service

```shell
systemctl status grafana-server
● grafana-server.service - Grafana instance
   Loaded: loaded (/lib/systemd/system/grafana-server.service; enabled; vendor preset: enabled)
   Active: active (running) since Sat 2020-06-13 15:20:37 CEST; 15s ago
     Docs: http://docs.grafana.org
 Main PID: 12133 (grafana-server)
    Tasks: 8 (limit: 2330)
   Memory: 22.3M
   CGroup: /system.slice/grafana-server.service
           └─12133 /usr/sbin/grafana-server --config=/etc/grafana/grafana.ini --pidfile=/var/run/grafana/grafana-server.

juin 13 15:20:38 grafana grafana-server[12133]: t=2020-06-13T15:20:38+0200 lvl=info msg="Executing migration" logger=mig
juin 13 15:20:38 grafana grafana-server[12133]: t=2020-06-13T15:20:38+0200 lvl=info msg="Created default admin" logger=s
juin 13 15:20:38 grafana grafana-server[12133]: t=2020-06-13T15:20:38+0200 lvl=info msg="Starting plugin search" logger=
juin 13 15:20:39 grafana grafana-server[12133]: t=2020-06-13T15:20:39+0200 lvl=info msg="Registering plugin" logger=plug
juin 13 15:20:39 grafana grafana-server[12133]: t=2020-06-13T15:20:39+0200 lvl=info msg="External plugins directory crea
juin 13 15:20:39 grafana grafana-server[12133]: t=2020-06-13T15:20:39+0200 lvl=info msg="HTTP Server Listen" logger=http
```

Connexion à Grafana

```shell
http://xx.xx.xx.xx:3000
```

[![grafana0.png](https://doc.ataxya.net/uploads/images/gallery/2020-06/scaled-1680-/grafana0.png)](https://doc.ataxya.net/uploads/images/gallery/2020-06/grafana0.png)

[![grafana2.png](https://doc.ataxya.net/uploads/images/gallery/2020-06/scaled-1680-/grafana2.png)](https://doc.ataxya.net/uploads/images/gallery/2020-06/grafana2.png)

[![grafana1.png](https://doc.ataxya.net/uploads/images/gallery/2020-06/scaled-1680-/grafana1.png)](https://doc.ataxya.net/uploads/images/gallery/2020-06/grafana1.png)

# InfluxDB & Telegraf

# Installation & configuration d'InfluxDB

### Installation

##### Via le dépôt de l'éditeur

Solution qui permet d'être tout le temps à jour.

```shell
curl -sL https://repos.influxdata.com/influxdb.key | sudo apt-key add -
source /etc/os-release
echo "deb https://repos.influxdata.com/debian $(lsb_release -cs) stable" | sudo tee /etc/apt/sources.list.d/influxdb.list
```

Installation

```shell
apt update && apt install influxdb
```

Lancer le service

```shell
service influxdb start
```

##### Via un packet

```shell
wget https://dl.influxdata.com/influxdb/releases/influxdb_1.8.0_amd64.deb
dpkg -i influxdb_1.8.0_amd64.deb
```

Le service n'est pas lancé, on le lance.

```shell
systemctl start influxdb.service
root@grafana:~# systemctl status influxdb.service
● influxdb.service - InfluxDB is an open-source, distributed, time series database
   Loaded: loaded (/lib/systemd/system/influxdb.service; enabled; vendor preset: enabled)
   Active: active (running) since Sun 2020-06-14 15:23:26 CEST; 4s ago
     Docs: https://docs.influxdata.com/influxdb/
 Main PID: 961 (influxd)
    Tasks: 10 (limit: 2330)
   Memory: 12.2M
   CGroup: /system.slice/influxdb.service
           └─961 /usr/bin/influxd -config /etc/influxdb/influxdb.conf

juin 14 15:23:27 grafana influxd[961]: ts=2020-06-14T13:23:27.127794Z lvl=info msg="Starting precreation service" log_id
juin 14 15:23:27 grafana influxd[961]: ts=2020-06-14T13:23:27.127799Z lvl=info msg="Starting snapshot service" log_id=0N
juin 14 15:23:27 grafana influxd[961]: ts=2020-06-14T13:23:27.127803Z lvl=info msg="Starting continuous query service" l
juin 14 15:23:27 grafana influxd[961]: ts=2020-06-14T13:23:27.127808Z lvl=info msg="Starting HTTP service" log_id=0NOkph
juin 14 15:23:27 grafana influxd[961]: ts=2020-06-14T13:23:27.127811Z lvl=info msg="opened HTTP access log" log_id=0NOkp
juin 14 15:23:27 grafana influxd[961]: ts=2020-06-14T13:23:27.128230Z lvl=info msg="Listening on HTTP" log_id=0NOkpheG00
juin 14 15:23:27 grafana influxd[961]: ts=2020-06-14T13:23:27.128352Z lvl=info msg="Starting retention policy enforcemen
juin 14 15:23:27 grafana influxd[961]: ts=2020-06-14T13:23:27.128759Z lvl=info msg="Storing statistics" log_id=0NOkpheG0
juin 14 15:23:27 grafana influxd[961]: ts=2020-06-14T13:23:27.128852Z lvl=info msg="Sending usage statistics to usage.in
juin 14 15:23:27 grafana influxd[961]: ts=2020-06-14T13:23:27.129630Z lvl=info msg="Listening for signals" log_id=0NOkph
```

### Configuration

Création d'une base pour Telegraf

```shell
influx -execute "CREATE DATABASE influx_db_telegraf"
```

Création d'un utilisateur

```shell
influx -execute "CREATE USER telegraf_user WITH PASSWORD 'telegraf_password'"
influx -execute "GRANT ALL ON influx_db_telegraf TO telegraf_user"
```

Configuration de la rétention

```shell
influx -execute "CREATE RETENTION POLICY "a_year" ON "influx_db_telegraf" DURATION 52w REPLICATION 1 DEFAULT"
```

# Prometheus

# Prometheus

<p class="callout info">Prometheus est disponible dans les dépôts Debian avec forcément un décalage avec la dernière version.</p>

### Installation via les packets

Actuellement, Prometheus est en version [2.7.1](https://packages.debian.org/buster/prometheus "Paquet : prometheus").

```shell
apt install -y prometheus prometheus-node-exporter
```

##### Prometheus

Contrôle du service

```shell
systemctl status prometheus
● prometheus.service - Monitoring system and time series database
   Loaded: loaded (/lib/systemd/system/prometheus.service; enabled; vendor preset: enabled)
   Active: active (running) since Sat 2020-06-13 18:45:04 CEST; 1min 39s ago
     Docs: https://prometheus.io/docs/introduction/overview/
 Main PID: 2259 (prometheus)
    Tasks: 10 (limit: 2330)
   Memory: 28.9M
   CGroup: /system.slice/prometheus.service
           └─2259 /usr/bin/prometheus

juin 13 18:45:04 grafana prometheus[2259]: level=info ts=2020-06-13T16:45:04.263785211Z caller=main.go:302 host_details="(Linux 4.19.0-9-amd64 #1 SMP Debian 4.19.118-2+deb10u1 (2020-06-07) x86_64 grafana (none))"
juin 13 18:45:04 grafana prometheus[2259]: level=info ts=2020-06-13T16:45:04.26395904Z caller=main.go:303 fd_limits="(soft=8192, hard=8192)"
juin 13 18:45:04 grafana prometheus[2259]: level=info ts=2020-06-13T16:45:04.264134173Z caller=main.go:304 vm_limits="(soft=unlimited, hard=unlimited)"
juin 13 18:45:04 grafana prometheus[2259]: level=info ts=2020-06-13T16:45:04.265086335Z caller=main.go:618 msg="Starting TSDB ..."
juin 13 18:45:04 grafana prometheus[2259]: level=info ts=2020-06-13T16:45:04.265651345Z caller=web.go:411 component=web msg="Start listening for connections" address=0.0.0.0:9090
juin 13 18:45:04 grafana prometheus[2259]: level=info ts=2020-06-13T16:45:04.274234991Z caller=main.go:633 msg="TSDB started"
juin 13 18:45:04 grafana prometheus[2259]: level=info ts=2020-06-13T16:45:04.275447813Z caller=main.go:693 msg="Loading configuration file" filename=/etc/prometheus/prometheus.yml
juin 13 18:45:04 grafana prometheus[2259]: level=info ts=2020-06-13T16:45:04.276361825Z caller=main.go:720 msg="Completed loading of configuration file" filename=/etc/prometheus/prometheus.yml
juin 13 18:45:04 grafana prometheus[2259]: level=info ts=2020-06-13T16:45:04.276671785Z caller=main.go:587 msg="Server is ready to receive web requests."
juin 13 18:45:09 grafana prometheus[2259]: level=error ts=2020-06-13T16:45:09.26766491Z caller=notifier.go:481 component=notifier alertmanager=http://localhost:9093/api/v1/alerts count=0 msg="Error sending alert" err="Post http://localh
```

Accès web

```shell
http://xx.xx.xx.xx:9090
```

[![Prometheus0.png](https://doc.ataxya.net/uploads/images/gallery/2020-06/scaled-1680-/Prometheus0.png)](https://doc.ataxya.net/uploads/images/gallery/2020-06/Prometheus0.png)
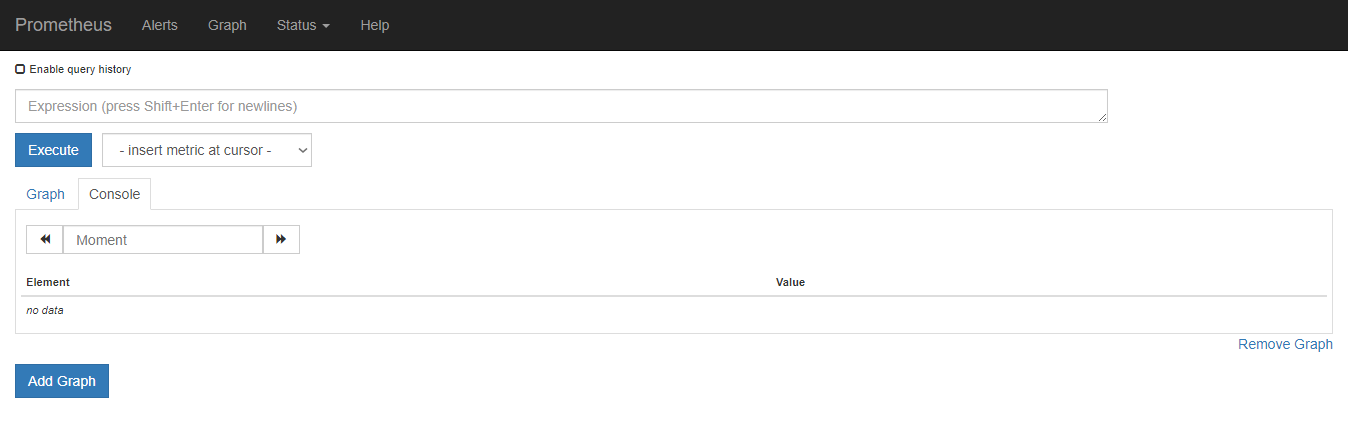
##### Node Exporter

Prometheus n'est rien sans Node Exporter. Car c'est Node Exporter qui collecte les données.

```shell
vi /etc/prometheus/prometheus.yml
```

De base,le fichier de configuration ce suffit à lui même. J'ai juste rajouté le cas avec un second Node Exporter.

```shell
scrape_configs:
  - job_name: 'prometheus'

    scrape_interval: 5s
    scrape_timeout: 5s

    static_configs:
      - targets: ['localhost:9090']

  - job_name: 'node'
    static_configs:
      - targets: ['monserveur:9100','second_serveur:9100']
```

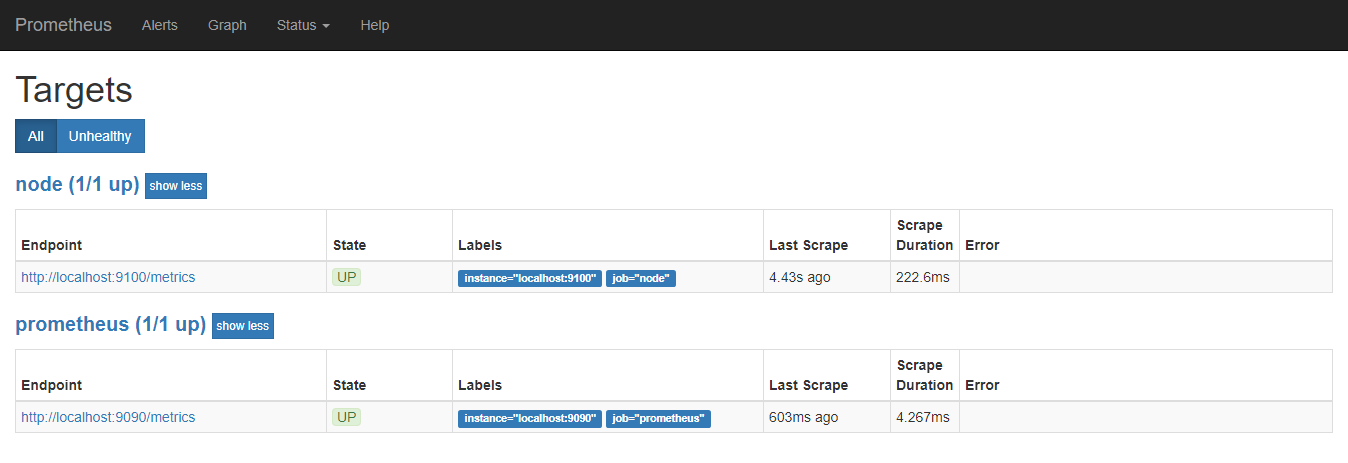
Pour voir si Node Exporter est bien connecter avec Prometheus : aller dans dans Status &gt; Targets

[![Prometheus1.png](https://doc.ataxya.net/uploads/images/gallery/2020-06/scaled-1680-/Prometheus1.png)](https://doc.ataxya.net/uploads/images/gallery/2020-06/Prometheus1.png)

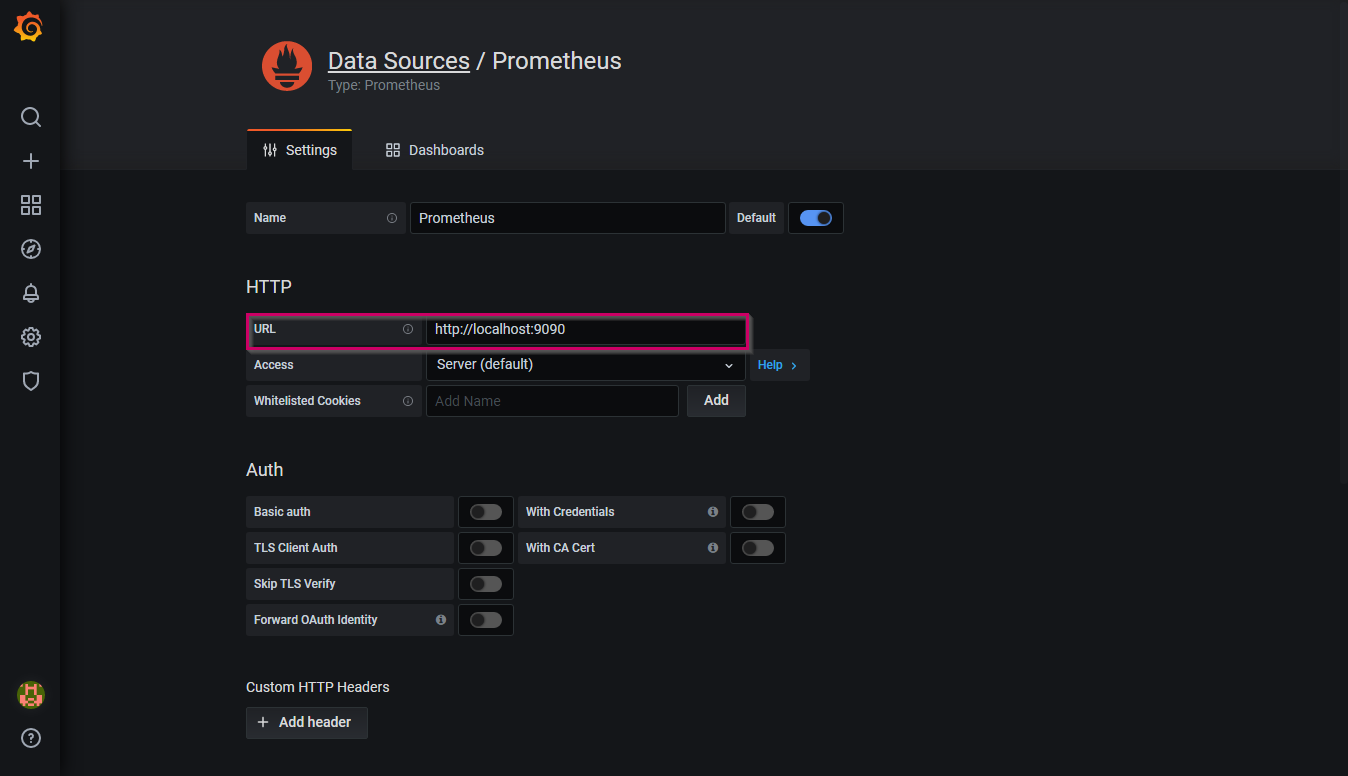
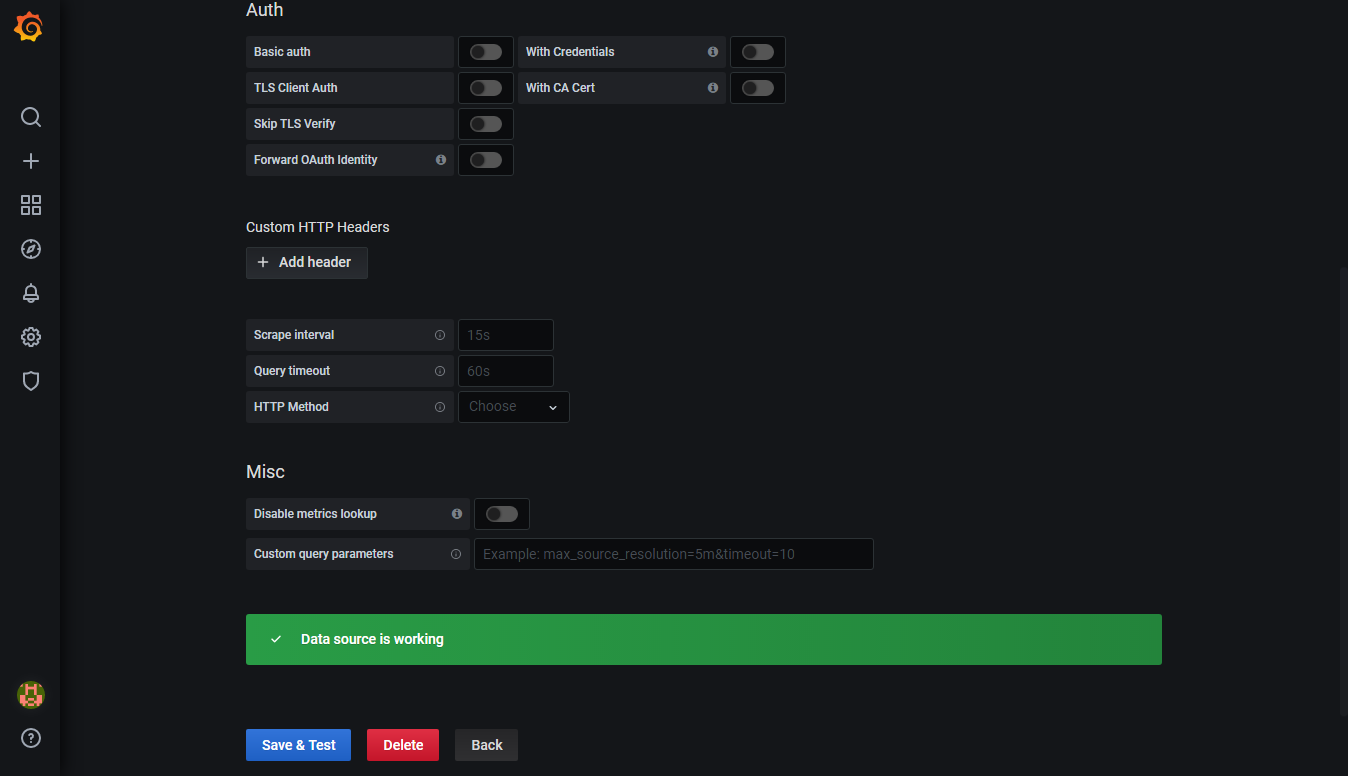
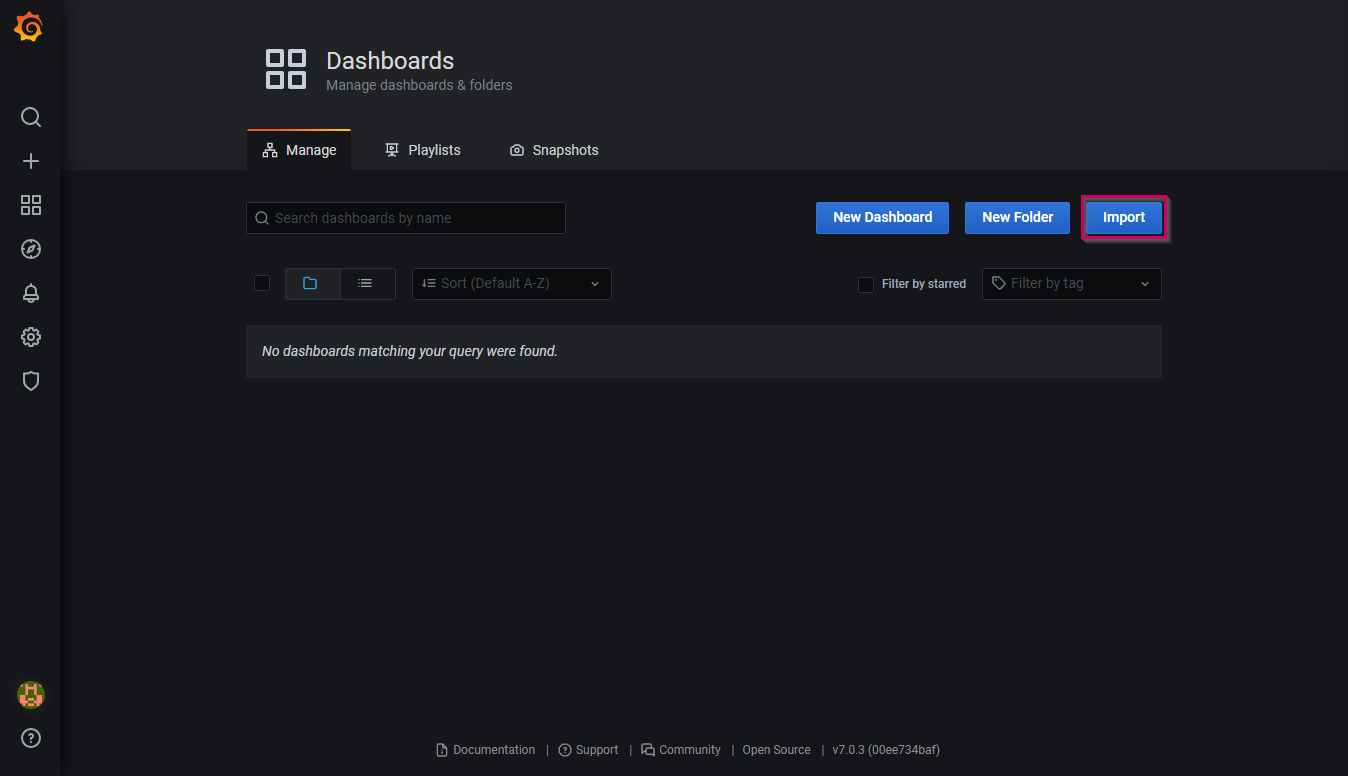
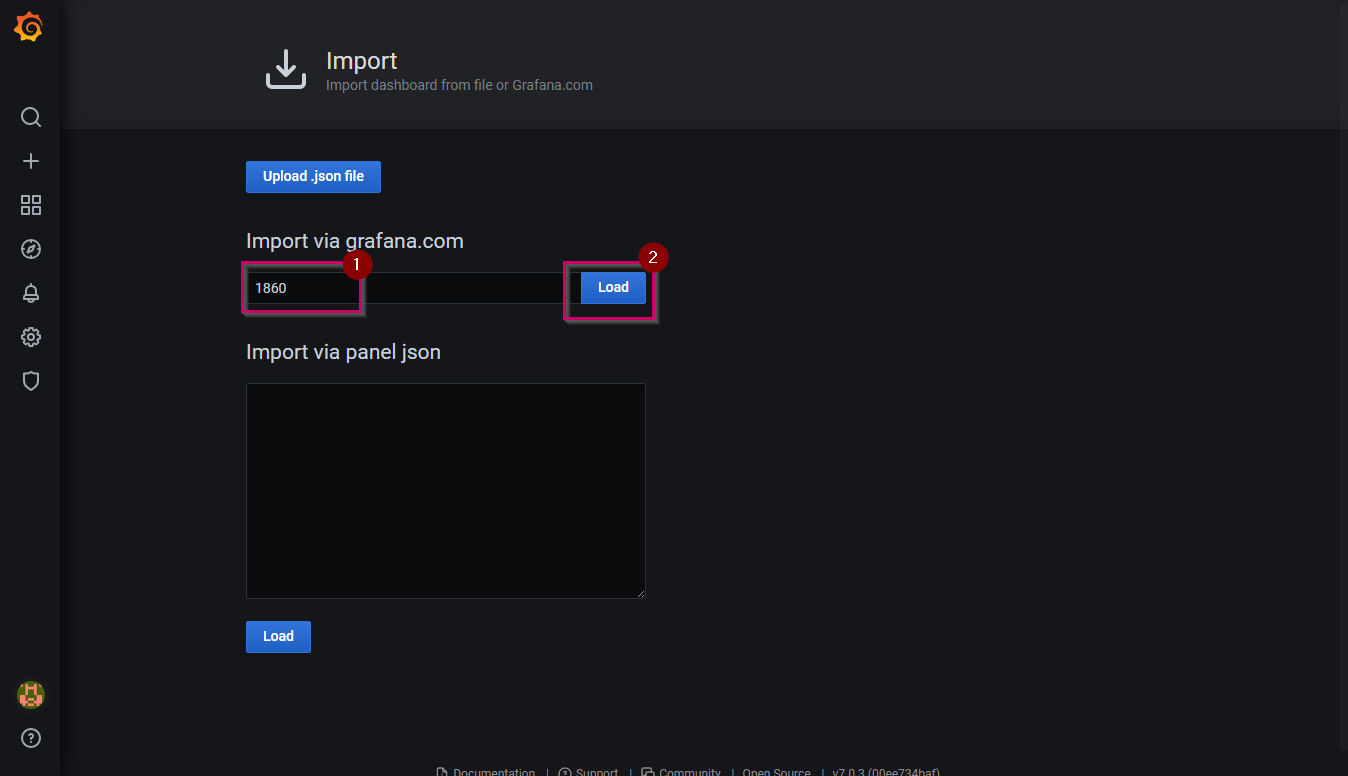
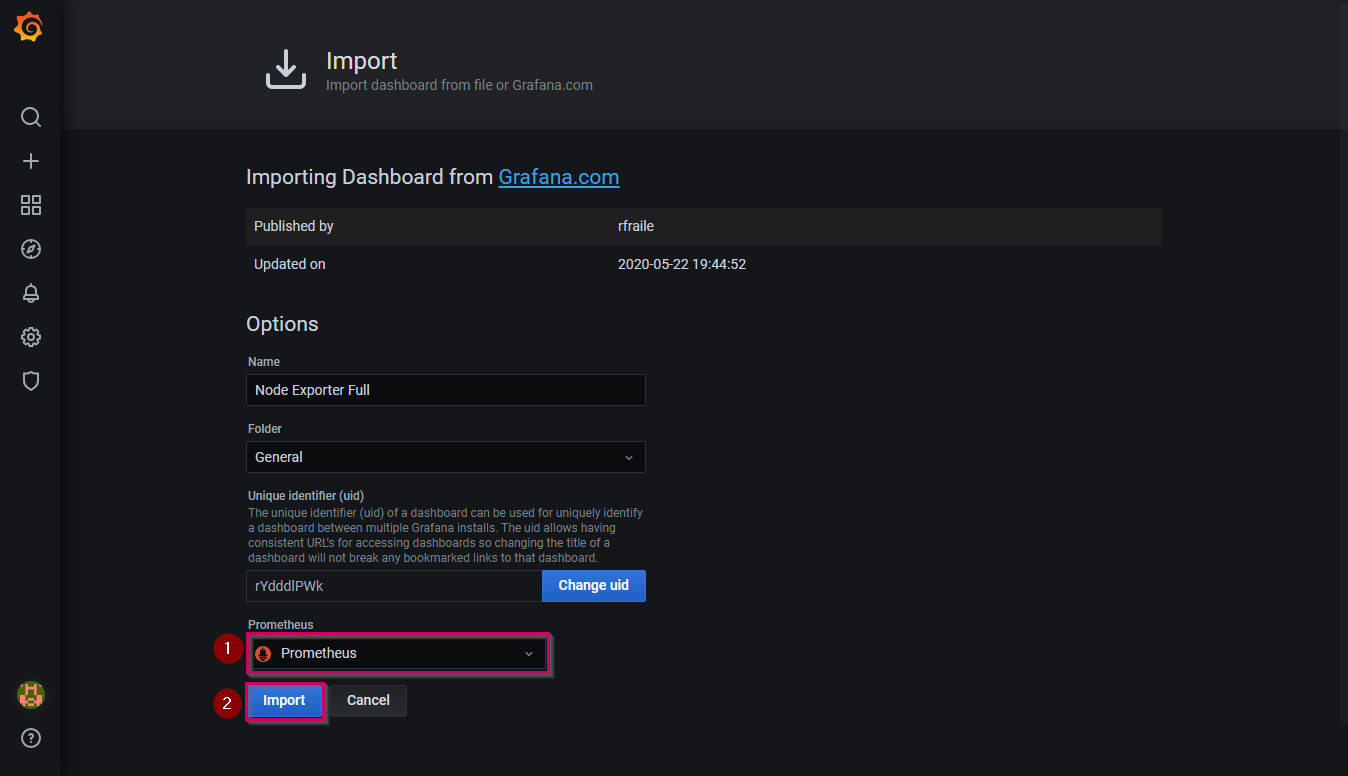
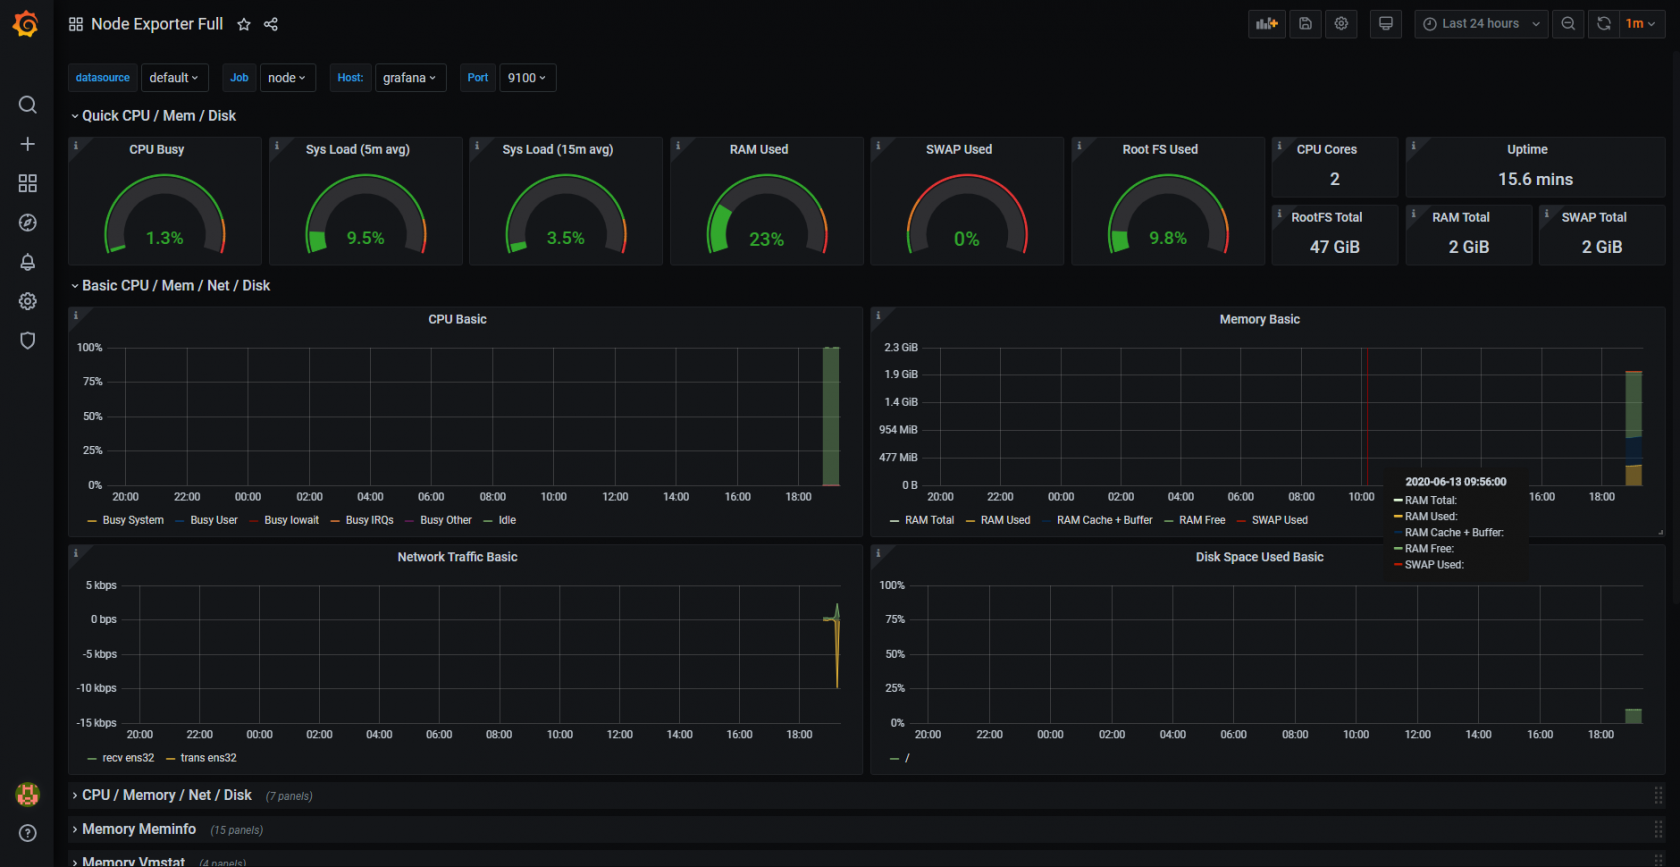
##### Prometheus comme source pour Grafana

[![grafana_prometheus_1.png](https://doc.ataxya.net/uploads/images/gallery/2020-06/scaled-1680-/grafana_prometheus_1.png)](https://doc.ataxya.net/uploads/images/gallery/2020-06/grafana_prometheus_1.png)
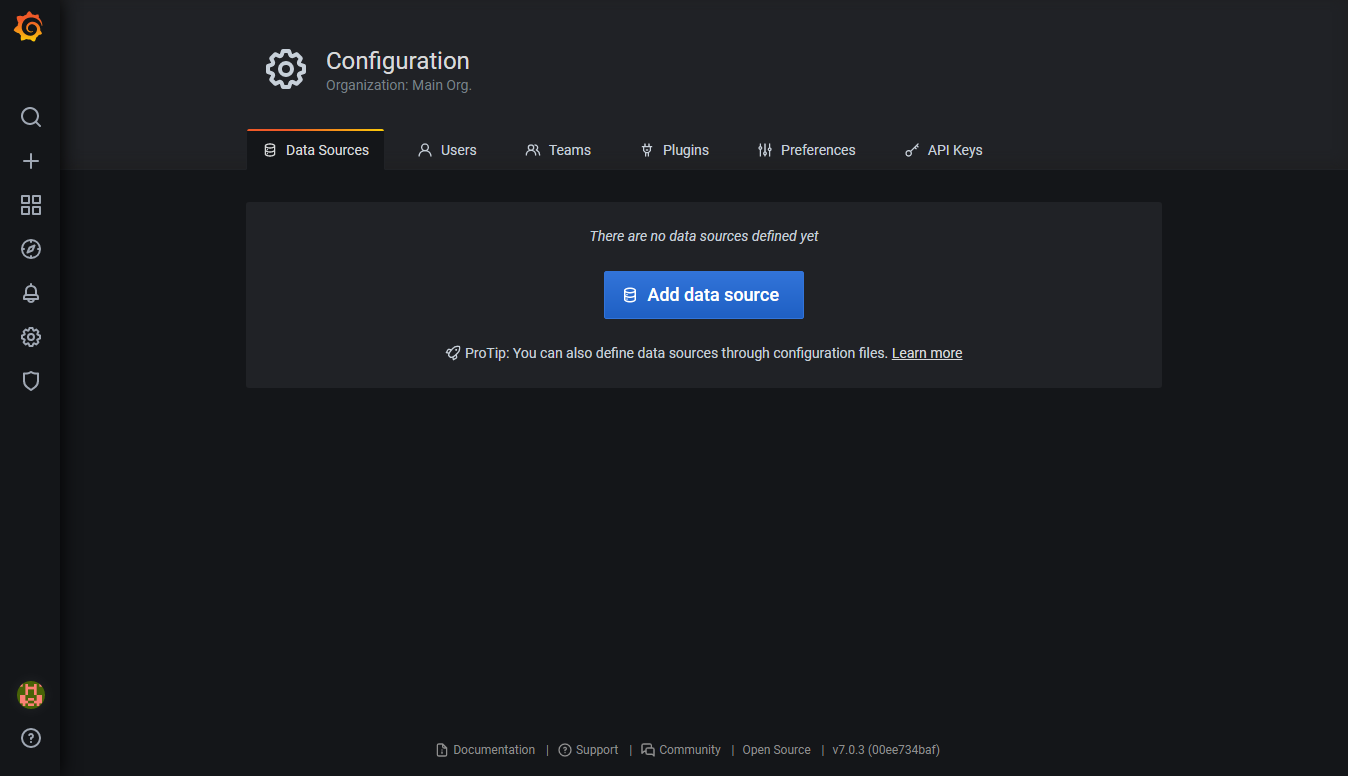
[![grafana_prometheus_2.png](https://doc.ataxya.net/uploads/images/gallery/2020-06/scaled-1680-/grafana_prometheus_2.png)](https://doc.ataxya.net/uploads/images/gallery/2020-06/grafana_prometheus_2.png)
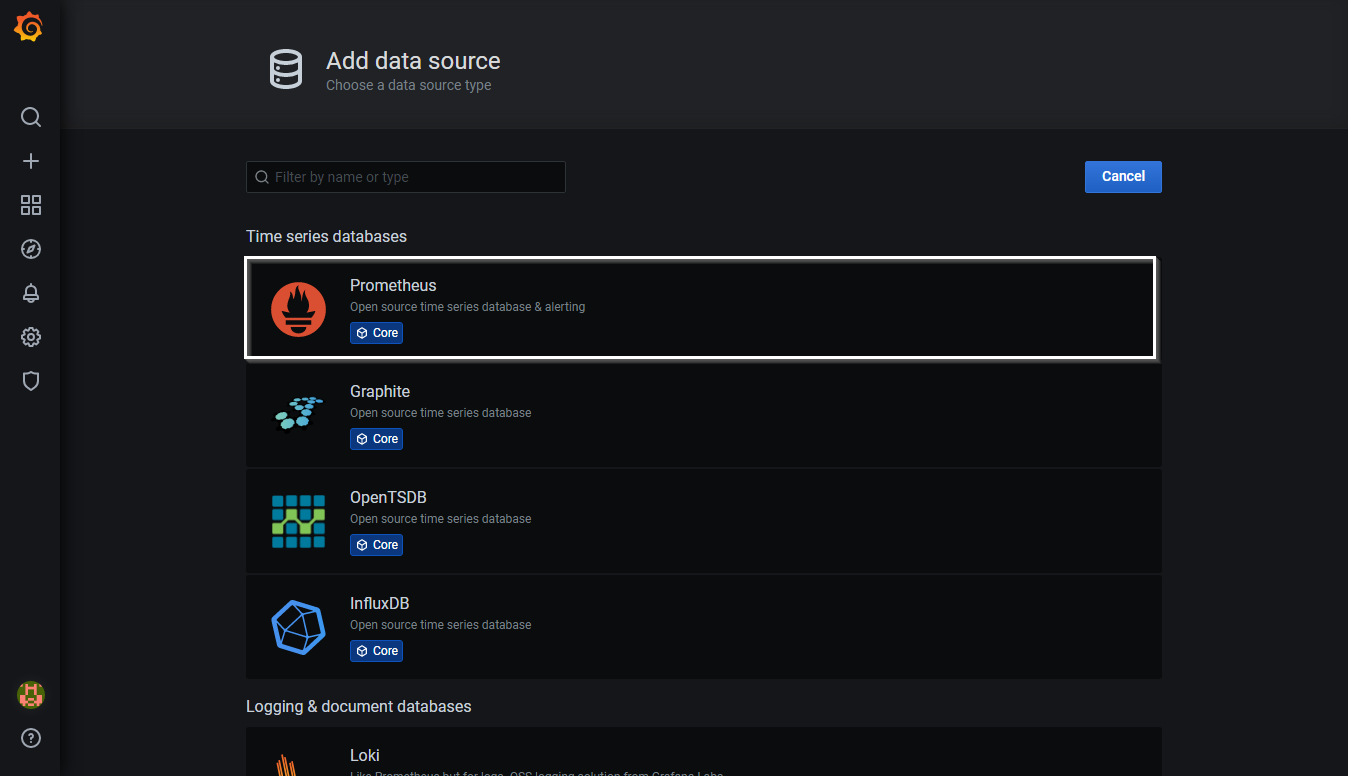
[![grafana_prometheus_3.png](https://doc.ataxya.net/uploads/images/gallery/2020-06/scaled-1680-/grafana_prometheus_3.png)](https://doc.ataxya.net/uploads/images/gallery/2020-06/grafana_prometheus_3.png)
[![grafana_prometheus_4.png](https://doc.ataxya.net/uploads/images/gallery/2020-06/scaled-1680-/grafana_prometheus_4.png)](https://doc.ataxya.net/uploads/images/gallery/2020-06/grafana_prometheus_4.png)
[![grafana_prometheus_5.png](https://doc.ataxya.net/uploads/images/gallery/2020-06/scaled-1680-/grafana_prometheus_5.png)](https://doc.ataxya.net/uploads/images/gallery/2020-06/grafana_prometheus_5.png)
[![grafana_prometheus_6.png](https://doc.ataxya.net/uploads/images/gallery/2020-06/scaled-1680-/grafana_prometheus_6.png)](https://doc.ataxya.net/uploads/images/gallery/2020-06/grafana_prometheus_6.png)
[![grafana_prometheus_7.png](https://doc.ataxya.net/uploads/images/gallery/2020-06/scaled-1680-/grafana_prometheus_7.png)](https://doc.ataxya.net/uploads/images/gallery/2020-06/grafana_prometheus_7.png)
[![grafana_prometheus_8.png](https://doc.ataxya.net/uploads/images/gallery/2020-06/scaled-1680-/grafana_prometheus_8.png)](https://doc.ataxya.net/uploads/images/gallery/2020-06/grafana_prometheus_8.png)
### Installation via les binaires pré-compilés

Pour être certains d'avoir la version la plus récente, on va passer par le dépot GIT

Pré-requis

```shell
apt install -y wget curl
```

```shell
groupadd --system prometheus
useradd -s /sbin/nologin --system -g prometheus prometheus
mkdir /var/lib/prometheus
```

Téléchargement et installation

```shell
mkdir -p /tmp/prometheus && cd /tmp/prometheus
curl -s https://api.github.com/repos/prometheus/prometheus/releases/latest | grep browser_download_url | grep linux-amd64 | cut -d '"' -f 4 | wget -qi -
tar xvf prometheus*.tar.gz
# cd prometheus*/
# mv prometheus promtool /usr/local/bin/
```

Contrôle que Prometheus est bien installer et savoir sa version

```shell
# prometheus --version
prometheus, version 2.19.0 (branch: HEAD, revision: 5d7e3e970602c755855340cb190a972cebdd2ebf)
  build user:       root@d4cf5c7e268d
  build date:       20200609-10:29:59
  go version:       go1.14.4
# promtool --version
promtool, version 2.19.0 (branch: HEAD, revision: 5d7e3e970602c755855340cb190a972cebdd2ebf)
  build user:       root@d4cf5c7e268d
  build date:       20200609-10:29:59
  go version:       go1.14.4
```

# Installer Node Exporter et ajouter à Prometheus

## Node Exporter

### A quoi sert Node Exporter ?

Node Exporter est le programme qui récupère les metrics (infos du système) et vas les rendre disponible par simple requête curl.

### Installation

#### Téléchargement

Pour commencer, télécharger la dernière version de Node Exporter ici: [Node-Exporter](https://prometheus.io/download/#node_exporter)

`wget https://github.com/prometheus/node_exporter/releases/download/v1.0.1/node_exporter-1.0.1.linux-amd64.tar.gz`

#### Dépaquetage

On extrait l'archive

`dpkg -xvf node_exporter-1.0.1.linux-amd64.tar.gz`

Puis on la déplace dans un répertoire qui lui permet d'être gérer par le système

`mv exporter-1.0.1.linux-amd64/node_exporter /usr/local/bin/`

#### Installation &amp; Mise en service

En réalitée, on installe pas vraiment Node Exporter, on crée juste une tache système qui vas lancer la commande.

Et pour ça, on crée un utilisateur node exporter qui va s'occuper du service.

`useradd -rs /bin/false node_exporter`

Ensuite on crée le fameux service.

`nano /etc/systemd/system/node_exporter.service`

Le fichier doit contenir les infos suivante:

```shell
[Unit]
Description=Node Exporter
After=network.target

[Service]
User=node_exporter
Group=node_exporter
Type=simple
ExecStart=/usr/local/bin/node_exporter

[Install]
WantedBy=multi-user.target
```

Maintenant il faut recharger le daemon

`systemctl daemon-reload`

Puis démarrer node\_exporter

`systemctl start node_exporter`

Il faut vérifier si node\_exporter fonctionne

`systemctl status node_exporter`

Si tout vas bien, alors on peut l'ajouter au service au démarrage

`systemctl enable node_exporter`

Pour savoir si tout vas bien:

`curl <a href="http://localhost:9100/metrics">http://localhost:9100/metrics</a>`

### Ajouter l'host à Prometheus

#### Ajout de l'host

Pour ajouter l'host il faut modifier le fichier de configuration de Prometheus

`nano /etc/prometheus/prometheus.yml`

Ajouter un target avec l'adresse ip voulu en dessous du target existant. Example avec 192.168.0.2:

```shell
  - job_name: 'node_exporter'
    scrape_interval: 5s
    static_configs:
      - targets: ['localhost:9100']
      - targets: ['192.168.0.2:9100']
```

#### Redémarrage de Prometheus

Pour que tout soit pris en compte il faut redémarrer le service prometheus:

`systemct restart prometheus`

### Vérification

Pour voire si tout vas bien, un petit tour sur votre interface prometheus ([http://prometheus-ip:9090/targets](http://prometheus-ip:9090/targets)) ou grafana et voir si votre host apparait bien !